


Track Your Fitness: Build a Powerful Workout App with PyQt5 and Matplotlib
Track Your Fitness: Build a Powerful Workout App with PyQt5 and Matplotlib
Learn how to build a feature-rich fitness tracking app using PyQt5 and Matplotlib. Track your workouts, visualize data, and toggle dark mode. Step-by-step tutorial.

In this guide, we will build a fitness-tracking application using PyQt5, Matplotlib, and a SQL database. Our application will allow users to input their workout details, such as the date, calories burned, distance covered, and a description of each workout. It will display the entered data in a table from our database and visually represent the data using a scatter plot. Additionally, as an added designed feature learn how to easily implement a dark mode option for a personalized user experience.

Prerequisites
To follow along with this tutorial, you should have a basic understanding of Python and Object-Oriented Programming. You will also need to have PyQt5 and Matplotlib installed. If you don't have them yet, you can install them using pip:
pip3 install PyQt5 matplotlibImporting the Required Modules
We start by importing the necessary modules and classes from PyQt5 and Matplotlib, yes there are a lot. This will give you good experience working with multiple modules within a single application. These modules provide the functionality we need to create the user interface and plot the data. From the PyQt Framework, we will use three core modules. These are QtWidgets, QtSql, and QtCore.
from PyQt5.QtCore import Qt, QDate
from PyQt5.QtWidgets import QApplication, QWidget, QLabel, QDateEdit, QLineEdit, QVBoxLayout, QHBoxLayout, QPushButton, QTableWidget, QTableWidgetItem, QHeaderView, QMessageBox, QCheckBox
from PyQt5.QtSql import QSqlDatabase, QSqlQuery

import matplotlib.pyplot as plt
from matplotlib.backends.backend_qt5agg import FigureCanvasQTAgg as FigureCanvas

import numpy as np
from sys import exit
We then import matplotlib which we will use to plot our data. PyQt and Matplotlib have different backends, therefore in order to get them to work together we will need to use the FigureCanvas class. We use this when working with these two libraries.
Creating the FitnessApp Class
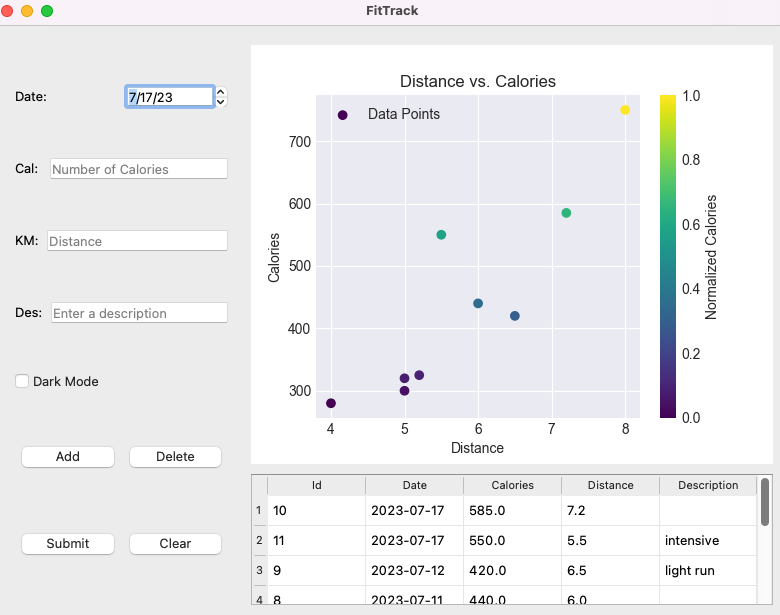
We create a class called FitnessApp that inherits from the QWidget class provided by PyQt5. This class will serve as the main window of our application. We set the window title and initial size in the constructor (__init__ method).
class FitnessApp(QWidget):
    def __init__(self):
        super().__init__()
        self.setWindowTitle("FitTrack")
        self.resize(800, 600)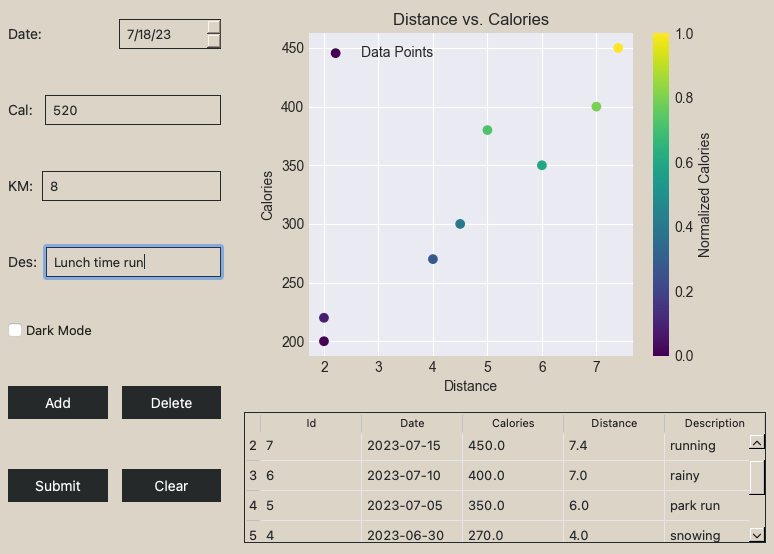
Designing the User Interface
Now, let's design the user interface for our fitness-tracking app. First, we create and configure the necessary widgets and layouts to arrange them.
The user interface consists of:
QDateEditwidget to select the workout date.QLineEditinput widget. Used to collect an input valueQPushButtona submit-style button. Buttons for adding, deleting, submitting, and clearing.QCheckBoxwidget for toggling dark mode.QTableWidgetfor displaying the workout data in a table.FigureCanvaswidget for displaying the matplotlib plot.
We arrange these widgets using various layouts such as QVBoxLayout and QHBoxLayout to achieve the desired interface layout. When thinking about your design, remember QVBoxLayout → QV → V → Vertical → Column
        # Create the date box
        self.date_box = QDateEdit()
        self.date_box.setDate(QDate.currentDate())

        # Create the input boxes for calories, distance, and description
        self.kal_box = QLineEdit()
        self.kal_box.setPlaceholderText("Number of Calories")
        self.dist_box = QLineEdit()
        self.dist_box.setPlaceholderText("Distance")
        self.description = QLineEdit()
        self.description.setPlaceholderText("Enter a description")

        # Create the buttons
        self.submit_btn = QPushButton("Submit")
        self.add_btn = QPushButton("Add")
        self.del_btn = QPushButton("Delete")
        self.clear_btn = QPushButton("Clear")
        self.dark_mode = QCheckBox("Dark Mode")

        # Create the table to display the workout data
        self.table = QTableWidget()
        self.table.setColumnCount(5)
        self.table.setHorizontalHeaderLabels(["Id", "Date", "Calories", "Distance", "Description"])
        self.table.horizontalHeader().setSectionResizeMode(QHeaderView.Stretch)

        # Create the Matplotlib figure and canvas
        self.figure = plt.figure()
        self.canvas = FigureCanvas(self.figure)

        # Create the main layout and the sub-layouts
        self.master_layout = QHBoxLayout()
        self.col1 = QVBoxLayout()
        self.col2 = QVBoxLayout()
        self.sub_row1 = QHBoxLayout()
        self.sub_row2 = QHBoxLayout()
        self.sub_row3 = QHBoxLayout()
        self.sub_row4 = QHBoxLayout()

        # Add the widgets and layouts to the main layout
        self.sub_row1.addWidget(QLabel("Date:"))
        self.sub_row1.addWidget(self.date_box)
        self.sub_row2.addWidget(QLabel("Cal: "))
        self.sub_row2.addWidget(self.kal_box)
        self.sub_row3.addWidget(QLabel("KM:"))
        self.sub_row3.addWidget(self.dist_box)
        self.sub_row4.addWidget(QLabel("Des:"))
        self.sub_row4.addWidget(self.description)

        self.col1.addLayout(self.sub_row1)
        self.col1.addLayout(self.sub_row2)
        self.col1.addLayout(self.sub_row3)
        self.col1.addLayout(self.sub_row4)
        self.col1.addWidget(self.dark_mode)

        btn_row1 = QHBoxLayout()
        btn_row2 = QHBoxLayout()
        btn_row1.addWidget(self.add_btn)
        btn_row1.addWidget(self.del_btn)
        btn_row2.addWidget(self.submit_btn)
        btn_row2.addWidget(self.clear_btn)
        self.col1.addLayout(btn_row1)
        self.col1.addLayout(btn_row2)

        self.col2.addWidget(self.canvas)
        self.col2.addWidget(self.table)

        self.master_layout.addLayout(self.col1, 30)
        self.master_layout.addLayout(self.col2, 70)

        self.setLayout(self.master_layout)
Is PyQt new to you? Are you ready to start creating and building your own apps? Learn how to build your own apps and learn the fundamentals of PyQt. Check out my new course in the Zero to Knowing series, Building Apps with Python in 2023.

Event Handling
We connect the signals emitted by the buttons to the corresponding slots. Signals are events triggered by user actions, and slots are the functions that handle those events. By connecting signals and slots, we enable the buttons to perform the desired actions when clicked. Event handling in PyQt is rather straightforward for our app. Here we can take our object and link it with the clicked event. Inside connect we will put the function we want to link.
        self.add_btn.clicked.connect(self.add_workout)
        self.del_btn.clicked.connect(self.delete_workout)
        self.submit_btn.clicked.connect(self.submit_clicked)
        self.clear_btn.clicked.connect(self.reset)
        self.dark_mode.stateChanged.connect(self.toggle_dark_mode)
Loading Data into the Table
We implement the load_data method to retrieve workout data from a SQLite database and populate the table. This method executes a SQL query to fetch the data and iterates over the results to insert rows into the table widget. First, we create a query (question) for our database, then we loop through every row of our database collecting the values of each column. Finally, we set the values to our columns in our QTableWidget.
    def load_data(self):
        self.table.setRowCount(0)
        query = QSqlQuery("SELECT * FROM fitness ORDER BY date DESC")
        row = 0
        while query.next():
            fit_id = query.value(0)
            date = query.value(1)
            calories = query.value(2)
            distance = query.value(3)
            description = query.value(4)

            self.table.insertRow(row)
            self.table.setItem(row, 0, QTableWidgetItem(str(fit_id)))
            self.table.setItem(row, 1, QTableWidgetItem(date))
            self.table.setItem(row, 2, QTableWidgetItem(str(calories)))
            self.table.setItem(row, 3, QTableWidgetItem(str(distance)))
            self.table.setItem(row, 4, QTableWidgetItem(description))

            row += 1
Adding and Deleting Workout Data
We implement the add_workout and delete_workout methods to add and delete workout data from the database, respectively. These methods are called when the corresponding buttons are clicked. They retrieve the input values from the widgets, execute the necessary SQL queries to perform the database operations, and update the table to reflect the changes.
    def add_workout(self):
        date = self.date_box.date().toString("yyyy-MM-dd")
        calories = self.kal_box.text()
        distance = self.dist_box.text()
        description = self.description.text()

        query = QSqlQuery()
        query.prepare("""
                      INSERT INTO fitness (date, calories, distance,        description)
                      VALUES (?, ?, ?, ?)
                      """)
        query.addBindValue(date)
        query.addBindValue(calories)
        query.addBindValue(distance)
        query.addBindValue(description)
        query.exec_()

        self.date_box.setDate(QDate.currentDate())
        self.kal_box.clear()
        self.dist_box.clear()
        self.description.clear()

        self.load_data()

    def delete_workout(self):
        selected_row = self.table.currentRow()

        if selected_row == -1:
            QMessageBox.warning(self, "Error", "You must choose a row to delete")

        confirm = QMessageBox.question(self, "Are you sure?", "Delete this workout?", QMessageBox.Yes | QMessageBox.No)
        if confirm == QMessageBox.No:
            return

        fit_id = int(self.table.item(selected_row, 0).text())

        query = QSqlQuery()
        query.prepare("DELETE FROM fitness WHERE id = ?")
        query.addBindValue(fit_id)
        query.exec_()

self.load_data()Calculating Correlation and Plotting Data
We implement the calculate_correlation and submit_clicked methods to calculate the correlation between calories and distance and plot the data on the matplotlib canvas.
The calculate_correlation method retrieves the distance and calorie data from the database, calculates the correlation coefficient using NumPy, and returns the result.
The submit_clicked method retrieves the distance and calorie data from the database, normalizes the calorie values, and plots the data points on the scatter plot. It also customizes the appearance of the plot, including labels, title, and color bar.
    def calculate_correlation(self):
        distances = []
        calories = []

        query = QSqlQuery("SELECT distance, calories FROM fitness")
        while query.next():
            distance = query.value(0)
            calorie = query.value(1)
            distances.append(distance)
            calories.append(calorie)

        correlation = np.corrcoef(distances, calories)[0, 1]
        return correlation


    def submit_clicked(self):
        correlation = self.calculate_correlation()

        # Retrieve distance and calories data for plotting
        distances = []
        calories = []
        query = QSqlQuery("SELECT distance, calories FROM fitness ORDER BY calories ASC")
        while query.next():
            distance = query.value(0)
            calorie = query.value(1)
            distances.append(distance)
            calories.append(calorie)

        min_calorie = min(calories)
        max_calorie = max(calories)
        normalized_calories = [(calorie - min_calorie) / (max_calorie - min_calorie) for calorie in calories]

        # Plot the data
        plt.style.use("seaborn-darkgrid")
        ax = self.figure.subplots()
        ax.scatter(distances, calories, c=normalized_calories, cmap='viridis', label='Data Points')
        ax.set_xlabel('Distance')
        ax.set_ylabel('Calories')
        ax.set_title('Distance vs. Calories')
        cbar = ax.figure.colorbar(ax.collections[0], label='Normalized Calories')
        ax.legend()
        self.canvas.draw()
Applying Styles
We implement the apply_styles and toggle_dark_mode methods to apply custom styles to the user interface and support dark mode.
The apply_styles method sets background colors, font styles, and other visual properties of the widgets and matplotlib plot. It customizes the appearance based on the selected style, which can be either the default or dark mode.
The toggle_dark_mode method is called when the dark mode checkbox is clicked. It updates the styles of the widgets and matplotlib plots to reflect the change in mode.
This can be a rather fun part, as we can use similar CSS techniques to style our app in Python. Instead of targeting the elements using h1, div, a, p as we do in HTML, with CSS in Python, we can target the classes we want to apply our styles to. QLabel, QPushButton, QTableWidget, etc.
    def apply_styles(self):
        self.setStyleSheet("""
            QWidget {
                background-color: #b8c9e1;
            }

            QLabel {
                color: #333;
            }

            QLineEdit, QComboBox, QDateEdit, QPushButton {
                background-color: #b8c9e1;
                color: #333;
                padding: 5px;
            }

            QTableWidget {
                background-color: #b8c9e1;
                color: #333;
                border: 1px solid #444;
            }

            QPushButton {
                background-color: #4caf50;
                color: #fff;
                padding: 8px 16px;
                font-size: 14px;
            }
        """)

      if self.dark_mode.isChecked():
         self.setStylesSheet(
           #Add Dark Mode Styling Here
           )

    def toggle_dark_mode(self):
        self.apply_styles()
We can use the .isChecked() method to determine the state of the QCheckBox, if the box is clicked then we can apply different styles for our app.
Database Initialization
We initialize the SQLite database by creating a connection using the QSqlDatabase class and setting the database name. If the database fails to open, an error message is displayed. As for the app to function, we need to have a database.
We also execute an SQL query to create the fitness table if it doesn't already exist. The table will store the workout data that we enter into our input fields.
db = QSqlDatabase.addDatabase("QSQLITE")
db.setDatabaseName("fitness.db")
if not db.open():
    QMessageBox.critical(None, "Error", "Can not open database!")
    exit(2)

query = QSqlQuery()
query.exec_("""
            CREATE TABLE IF NOT EXISTS fitness (
                id  INTEGER PRIMARY KEY AUTOINCREMENT,
                date TEXT,
                calories REAL,
                distance REAL,
                description TEXT
            )
            """)
Starting the Application
To start the application, we create an instance of the QApplication class, which represents the application itself, giving it an empty list as an argument. Then, we create an instance of the FitnessApp class, which represents the main window of our app. Finally, we call the show method to display the window, and the exec_ method of the QApplication instance to start the event loop and run the application.
if __name__ in "__main__":
    app = QApplication([])
    main = FitnessApp()
    main.show()
    app.exec_()
Conclusion
This tutorial covered the step-by-step process of building a fitness-tracking application using PyQt5 and Matplotlib. I explained the purpose and functionality of each step, including designing the user interface, connecting signals and slots, interacting with a SQLite database, calculating correlations, and visualizing data using a scatter plot. We also demonstrated how to customize the user interface with dark mode. I hope you had as much fun as I’ve had! Try using these techniques to create your own application.
FAQs
Can I customize the user interface of the fitness tracker app?
Yes, PyQt provides extensive options for customizing the user interface. You can modify the layout, colors, fonts, and more to suit your preferences.
Can I use a different database instead of SQLite?
You sure can! PyQt supports various databases through its Qt SQL module. You can easily adapt the code to work with databases like MySQL or PostgreSQL.
How can I deploy the app to other platforms?
PyQt allows you to create cross-platform applications. With the appropriate tools and packaging techniques, you can deploy your app on Windows, macOS, or Linux. As a beginner tool, look into pyinstaller
Are there any performance considerations when visualizing large datasets with Matplotlib?
Matplotlib is capable of handling large datasets efficiently. However, you should still optimize your code and use techniques like data sampling or interactive plots for better performance.
👋 As we start to gain a wider audience base, I’ll begin doing weekly shoutouts to a country where our readers are from!
Hello to my Chile 🇨🇱 readers - Great to have you here!